Improving Health Equity with Advanced Data Science Methods and Geospatial Analytics
Coauthored by Jarrod Bullard, Senior Research Data Scientist at RTI Health Solutions
This is part three of a three-part series on improving health equity in research. Read the other two articles here:
Part 1: What Factors Influence Health Equity - or Inequity?
Part 2: Advancing Health Equity: The Crucial Role of Pharma and Medtech Developers
According to health.gov, “social determinants of health (SDOH) are the conditions in the environments where people are born, live, learn, work, play, worship, and age that affect a wide range of health, functioning, and quality-of-life outcomes and risks.” Without reliable and timely SDOH data and analytics, social needs and inequities are hard to identify and address. Because there is no single data source that provides well-grounded information, it has been a challenge to find guidance for health equity improvement initiatives and demonstrate results. To fill this gap, researchers at RTI have developed an SDOH database that merges artificial intelligence (AI) and advanced spatial analytics in a risk-adjustment framework.
Called RTI Rarity™, this database uses a supervised machine learning method known as random forests and other state-of-the-art predictive analytic methods to provide localized SDOH risk scores constructed with a health equity focus. It generates the Local Social Inequity (LSI) score by drawing on over 40 public and private datasets, including those from the American Community Survey, Centers for Disease Control and Prevention, Opportunity Atlas, and Department of Housing and Urban Development, among many others.
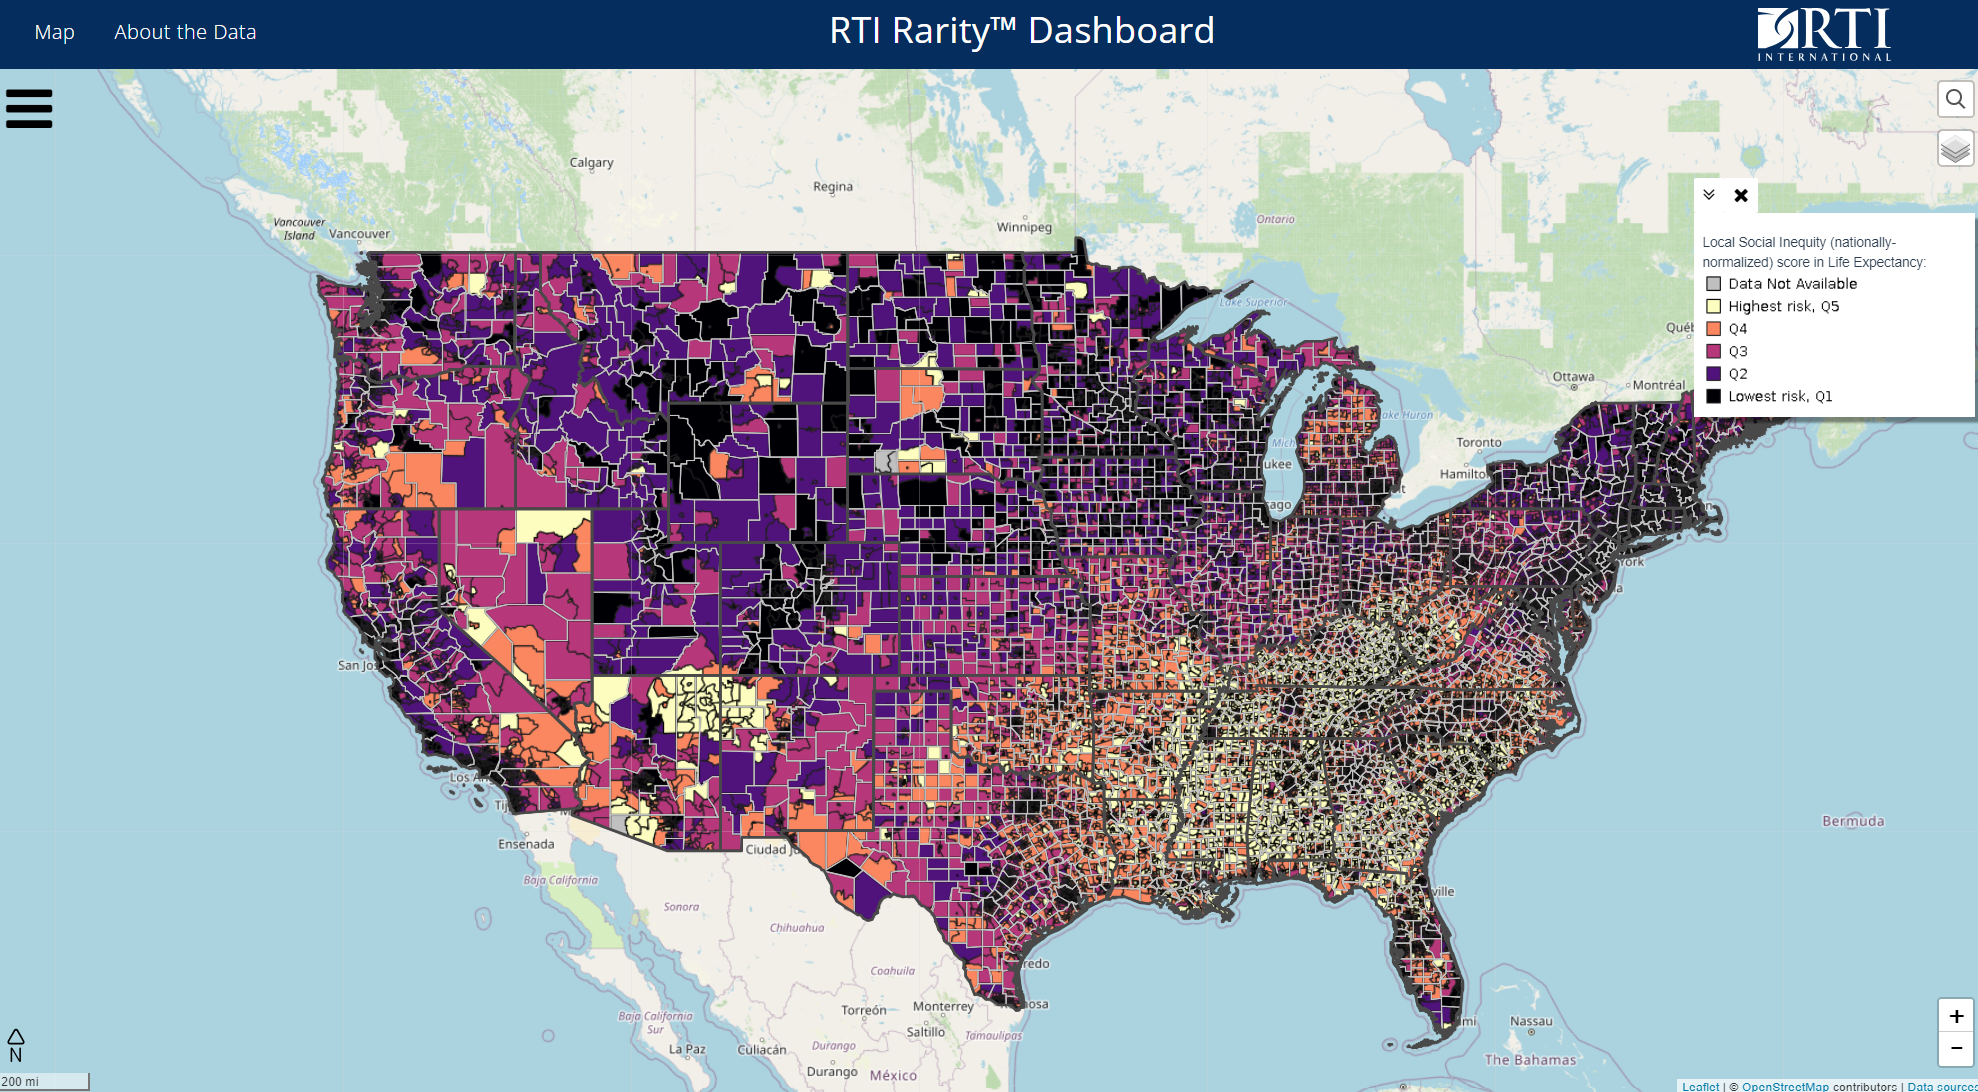
Screenshot of the RTI Rarity dashboard
 The RTI Rarity™ LSI score uses over 200 area-level variables across 10 domains at the census, zip code, and county levels for predicting life expectancy and other health outcomes. Together, these scores yield meaningful insights into the neighborhood-level drivers affecting local health outcomes. In benchmarking and validation analyses, RTI Rarity™ explained 70% of neighborhood variation in life expectancy across the United States. This was a substantial improvement over commonly used indices, such as the Area Deprivation Index, the Social Deprivation Index, and the Social Vulnerability Index, that explain only 29-34% of the life expectancy variation nationally.
RTI Rarity™ is well positioned to help improve health equity and reduce disparities. Not only can RTI Rarity’s LSI scores identify socially vulnerable populations who are at high risk of poor health outcomes, it can uncover the underlying social, behavioral, and contextual drivers of inequities among historically vulnerable populations and communities.
Contact the RTI Health Solutions team today to schedule a demo of RTI Rarity™.
About
RTI Rarity’s validated data and scores have been deployed in research projects across the RTI International, with funding from the Centers for Disease Control and Prevention, Centers for Medicare & Medicaid Services, National Institute on Drug Abuse, Substance Abuse and Mental Health Services Administration, and more.
The team has been recognized with a 2022 Disruptive Tech Program Award by G2Xchange and FedHealthIT, a 2023 RTI Press Editorial Board Award for a peer-reviewed journal article about the LSI score development and a 2023 RTI Commercialization Enterprise Award.