Local Social Inequity Score Offers High Acuity Social Risk Data Analysis
The U.S. Food and Drug Administration (FDA) recently released guidance that outlines specific diversity requirements sponsors must submit for clinical studies involving drugs, devices, and biological products. Compliance with these guidelines, which introduce the use of Diversity Action Plans (DAPs), will be mandatory 180 days after the final guidance is published for clinical trials beginning enrollment. Sponsors will need to identify potential obstacles to enrollment, such as geographic disparities and socioeconomic factors, and to develop plans to overcome these challenges.
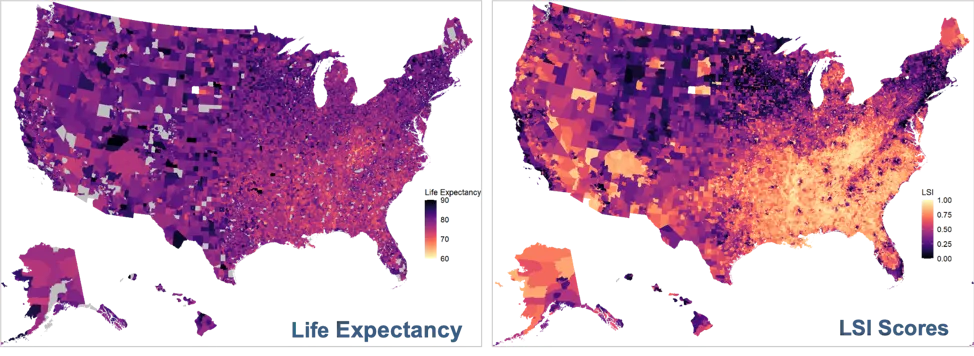
What is the RTI Rarity Local Social Inequity score?
The RTI Rarity tool merges artificial intelligence (AI), advanced data science methods, and geospatial analytics in a risk adjustment framework. Featuring a supervised machine learning method known as random forests (RFs) and other state-of-the-art predictive analytics methods, it provides high-resolution social determinants of health (SDoH) composite scores constructed with a health equity focus.
What data does the RTI Rarity LSI score leverage?
The RTI Rarity tool creates and delivers the Local Social Inequity (LSI) score by drawing on 40+ public and private datasets from publicly available federal, state, non-profit, and academic resources, including:
- American Community Survey (ACS) from the U.S. Census Bureau
- USDA's Food Environment Atlas
- CDC's Wide-ranging ONline Data for Epidemiologic Research (WONDER)
- Department of Housing and Urban Development (HUD)
- Child Opportunity Index (COI)
- Opportunity Atlas
- and 34+ other datasets
The RTI Rarity LSI score utilizes 200+ area-level variables across 10 domains at the Census, zip code, and county levels for predicting life expectancy and other health outcomes. Together, these scores yield meaningful insights into the neighborhood-level drivers affecting local health, providing sponsors with the data they need to comply with the new FDA requirements.